Introduction to Spectral Balance
- Spectral balance refers to the relative level of frequency bands across the audible range (20 Hz - 20 kHz).
- A “flat” spectral balance is a reference ideal: roughly even relative level across the spectrum.
- Understanding spectral balance helps improve clarity and tonal balance in recordings.
Levels of Perspective in Spectral Analysis
- Different levels of detail reveal unique aspects of a recording.
- Allows a multi-dimensional view of sound material.
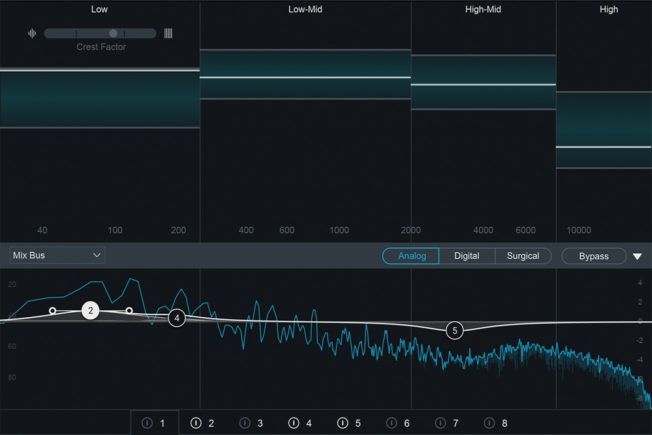
- Listening and visual analysis tools help evaluate spectral distribution.
Subjective Analysis of Spectral Balance
- Holistic listening is crucial for understanding balance.
- Identify prominent (over-represented) or deficient (under-represented) frequency bands.
- Detect resonances and their approximate frequencies.
- Ensure instrument levels align with the intended musical style.
Evaluating Overall Bandwidth
- Check if the recording covers the full range (20 Hz - 20 kHz).
- Identify whether the recording is band-limited.
- Overtones from cymbals and brass instruments extend to 20 kHz.
What to Listen For in Spectral Balance
- Is the overall tone bright, dark, mid-forward, or scooped?
- Do certain bands feel harsh, muddy, boxy, or hollow?
- Does the balance support the genre and the lead element?
Assessing Overall Balance
- Determine whether different sound sources are balanced correctly.
- Identify if any element is too dominant or too weak.
Comparing with Reference Sounds
- Use reference recordings from the same genre.
- Helps establish a benchmark for timbral goals.
- Guides production and mixing decisions.
- Real-time spectral analyzers: Provide a visual representation of frequency content.
- Examples (REAPER): TB Spectrogram, Spectrogram (JSFX), Spectral Peaks.
- Tonal balance meters: Compare the overall spectral contour against a target range.
- Reference track workflow: Level-matched A/B comparisons in the same genre.
- Band-isolation listening: EQ/bandpass filters or spectral edits to hear a specific region.
Aesthetic Considerations in Spectral Balance
- Aim to highlight desirable sonic qualities.
- Consider how the recording compares to a live experience.
- Address spectral imbalances that impact clarity.
Bridge: Spectral Balance ↔ Timbre
- Spectral balance describes the mix-level distribution of energy across frequency bands.
- Timbre is the source-level sound quality we perceive (beyond pitch and loudness).
- Timbre is shaped by:
- Spectrum / spectral envelope (which bands are present and emphasized)
- Dynamic envelope (attack, sustain, decay)
- Noise/inharmonic content (breath, buzz, distortion, room)
Defining Timbre
- Perceived sound quality beyond pitch and loudness.
- Often defined by contrast: what makes similar sounds distinct.
- Two key aspects:
- Overall quality (representation, affect, etc.).
- Acoustic content (spectrum, spectral envelope, dynamics).
Analyzing Timbre in a Recording
- Consider content (acoustic features), character (perceptual descriptors), and manifestation (how the recording chain/mix presents it).
- Timbre lacks a single, universally shared analytical vocabulary.
- Examine component parts in relation to the whole.
General Approaches to Timbre Analysis
- Two Levels of Perspective: individual sound vs. sound source (instrument/voice).
- Dual Information Streams: character (expressive) and content (physical/acoustic).
- Sound Object: analyze a sound “as itself,” out of musical context.
- Deep Listening: repeated, focused listening for small differences.
Key Components of Timbre Analysis
- Dynamic Envelope: Shape and changes over time.
- Spectral Content: Frequencies present in a sound.
- Spectral Envelope: The overall “shape” of energy across frequency (and how that shape changes over time).
- Pitch Definition: Presence and clarity of pitch.
Process of Timbre Analysis
- Isolate the Sound: Consider as a discrete object.
- Observe & Evaluate: Dynamic envelope, spectral content, spectral envelope.
- Describe: Use objective terminology for analysis.
- Typology Tables & Graphing Notation.
- Timbre Analysis Graph: Pitch, dynamics, spectral data.
- Sound Analysis Software: Helps visualize timbre.
- Spectrograms: Aid in popular music analysis.