Sound and hearing
What you’ll learn
- How amplitude, frequency, phase, and harmonics shape sound
- How the ear turns pressure waves into perception
- How psychoacoustics affects what we hear
- How these ideas guide recording and mixing decisions
- How to protect your hearing throughout your career
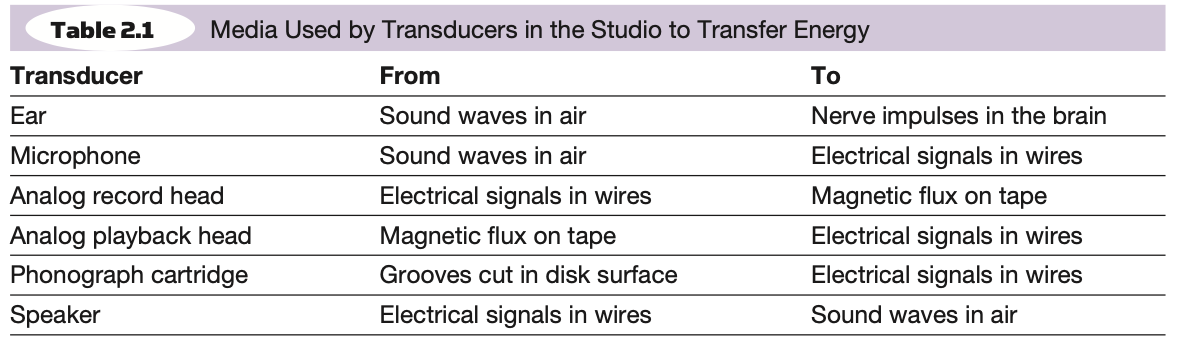
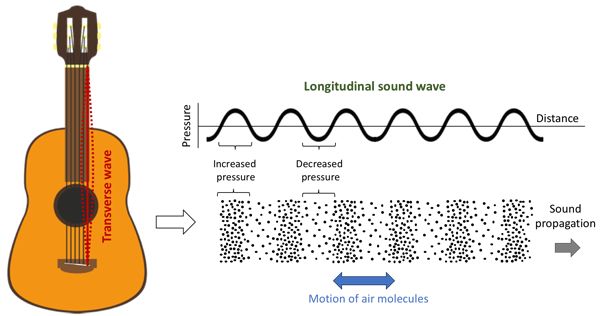
Sound begins with changing air pressure

Amplitude
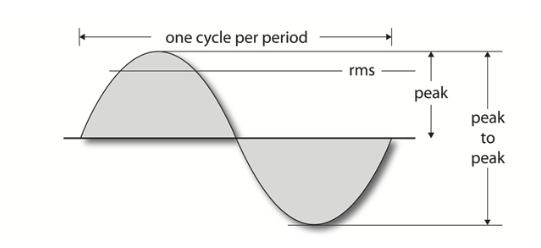
Greater amplitude usually sounds louder
- Compare the level of a whisper with the level of a shout.
- Try the interactive amplitude demo .
- Watch your recording levels. Too much amplitude can cause clipping and distortion.
Frequency describes how fast a wave repeats
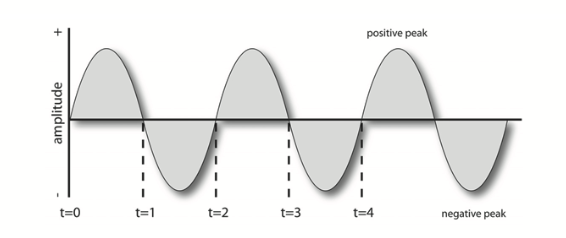
- Frequency measures the number of cycles a wave completes each second.
- We measure it in hertz (Hz).
- Frequency strongly influences perceived pitch.
Frequency shapes pitch and the balance of a mix
- Compare a low bass note with a high whistle.
- Try the interactive frequency demo .
- When sounds occupy the same frequency range, they can compete for attention in a mix.
Phase describes timing between waves
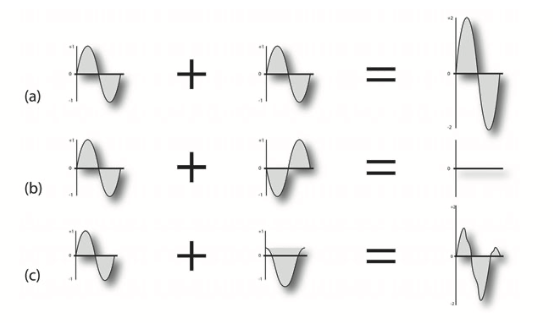
- Phase describes the timing relationship between two waves.
- When similar waves fall out of phase, some frequencies may weaken or cancel.
- Hear it in this phase-cancellation demonstration .
Harmonics give sounds their character
- Most musical sounds contain a fundamental frequency plus higher partials.
- The pattern and strength of those partials help define timbre.
- This is why a guitar and piano sound different even when they play the same note.
- Explore the Fourier Series 3D demonstration .
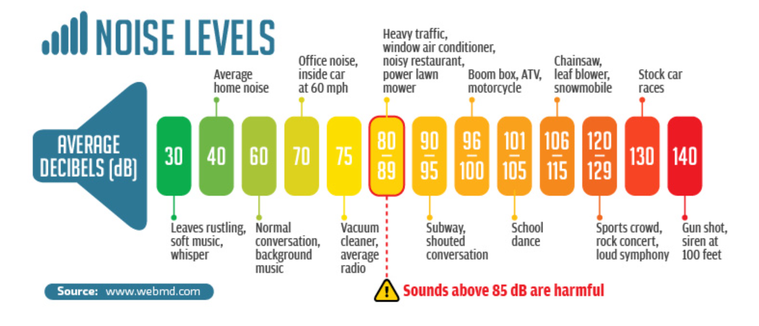
Decibels describe level on a logarithmic scale
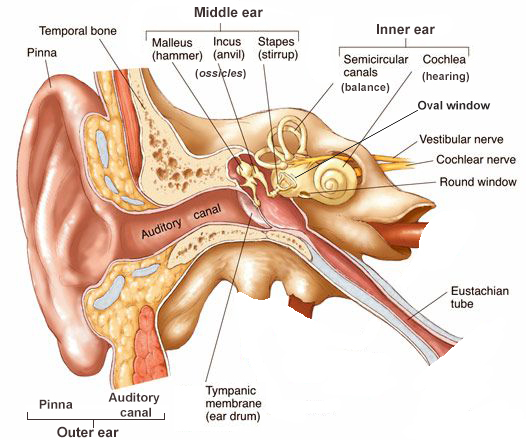
The ear turns pressure changes into neural signals
One sound can hide another
- One sound can make another harder to hear, especially when they occupy nearby frequencies.
- Kick drum and bass guitar often mask each other.
- MP3 and AAC encoders use masking models to remove sounds that listeners are unlikely to notice.
Try the auditory masking experiment .
The brain can create a beat that is not in either ear
- Send a slightly different frequency to each ear and the listener may perceive a third, pulsing beat.
- For example, 440 Hz in the left ear and 446 Hz in the right can produce a perceived 6 Hz beat.
- The effect shows that hearing depends on how the brain combines information from both ears.
Try the binaural beat generator with headphones.
Our sensitivity changes across the frequency range
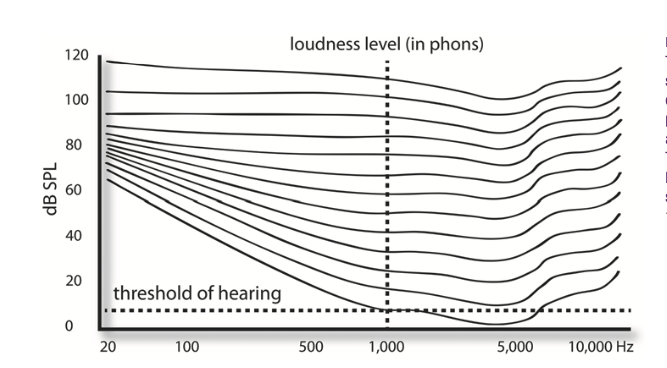
Playback level changes the tonal balance we perceive
- Our ears are most sensitive to the midrange.
- Bass must be physically louder than midrange to sound equally loud.
- At low monitoring levels, bass and treble often seem weaker.
Try the equal-loudness experiment .
Safe listening time shrinks as level rises
- NIOSH recommends no more than 85 dBA averaged over 8 hours.
- Each 3 dB increase doubles the sound energy and halves the recommended exposure time.
- 88 dBA: 4 hours. 94 dBA: 1 hour. 100 dBA: 15 minutes.
- Loud concerts can approach 100 dBA. Earbuds at full volume can reach dangerous levels too.
Sources: NIOSH noise exposure limits · WHO safe listening
Muffled hearing and ringing are warning signs
- Muffled hearing after a loud event is a temporary threshold shift.
- Ringing or buzzing is tinnitus.
- Both signal that the auditory system has been stressed.
- The symptoms may fade, but repeated exposure can cause permanent damage.
- In humans, damaged cochlear hair cells do not regrow.
Protect your hearing before it becomes a problem
- Measure sound levels instead of guessing. The NIOSH Sound Level Meter app is free for iOS.
- Keep personal-listening volume low enough to hear comfortably without strain.
- Choose a comfortable monitoring level and resist turning it up as your ears tire.
- Bring earplugs to shows. Foam plugs protect well; musician’s plugs preserve more of the frequency balance.